TAGS gets a timeline widget to display your latest archived tweets (replacement for the Twitter search timeline widget)
This is a cross post from my personal blog
On 23 March 2018 Twitter announced that it was retiring search timeline widgets, suggesting people moved to a Curate a Collection of Tweets. For a lot of people, myself included, this is far from an ideal solution. Given the number of hashtag communities I’m part of I’d much prefer to set something up and let it run in the background.
For TAGS users the good news is I’ve created a custom widget to display the last 10 results from a TAGS Archive. This means you can display a search timeline which will automatically display new results when these are collected in TAGS. If you are reading this from my site rather than via a RSS reader an example is embedded below:
Creating your own Twitter search timeline widget
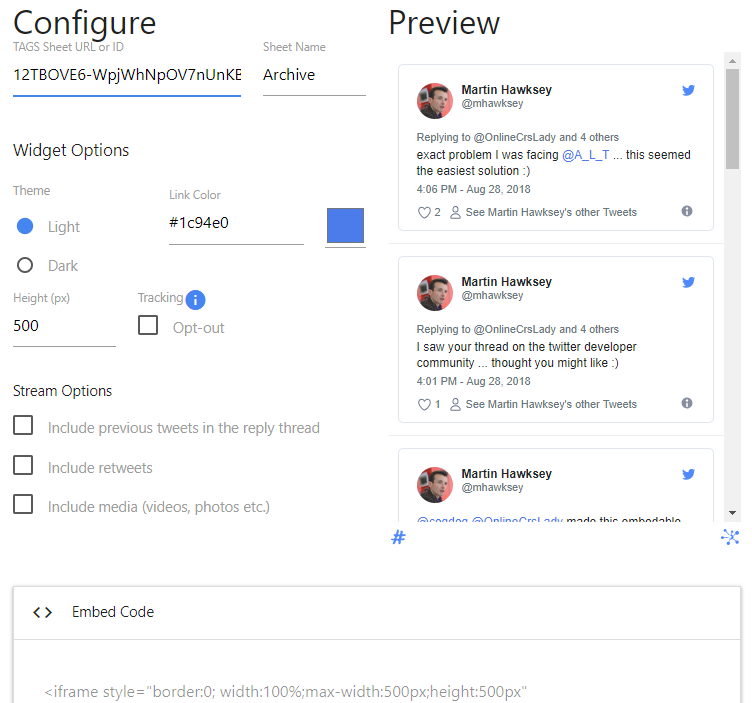
To create your own widget either setup a TAGS archive or use an existing one. When the Google Sheet is shared so that ‘anyone with a link can view’ use the TAGS Widget Setup Page to configure the widget appearance before grabbing the embed code:

Note: Given TAGS defaults to updating every hour the widget content currently only updates when the page is refreshed.
Under the hood
The widget itself runs off a basic HTML/JavaScript page. Twitter provide a JavaScript API that is able to scan a page for blockquote.twitter-tweet elements and turn them into fully-rendered embedded Tweets. To get the blockquote.twitter-tweet elements into a page I’m using the Google Visualisation API to query a Google Sheet and pull content into a Table Chart. There are actually a number of libraries that can read a Google Sheet into a webpage. The reason I went with this particular combination is there is a handy PatternFormat method that makes it easy to combine values from different columns required to create a blockquote.twitter-tweet the Twitter JavaScript API recognises:
// format the text column into a format that Twitter will convert into a tweet
var formatter = new google.visualization.PatternFormat('{1}
— @{0} {2}
');
formatter.format(data, , c['text'], c['time'], c['id_str']], c['text']); // Apply formatter and set the formatted value of the first column.
The Google Visualisation API also has an addListener() method which allows us to wait until the table is ready before asking the Twitter widget to render each tweet:
google.visualization.events.addListener(table, 'ready', function () {
  twttr.widgets.load();
});
The last trick is to tweak the css of the embedded tweet to reduce the font size. To do this we need to jump into the Shadow DOM the Twitter widget JavaScript generates and add some custom styling:
      twttr.events.bind('rendered', function (event) {
           var hosts = document.getElementsByTagName('twitterwidget');
           var hostList = [].slice.call(hosts);
           hostList.forEach(function(el){
               var style = document.createElement('style');
               style.innerHTML = '.SandboxRoot.env-bp-min, .SandboxRoot.env-bp-min .TweetAction-stat, .SandboxRoot.env-bp-min .TweetAuthor-screenName, .SandboxRoot.env-bp-min .Tweet-alert, .SandboxRoot.env-bp-min .Tweet-authorScreenName, .SandboxRoot.env-bp-min .Tweet-card, .SandboxRoot.env-bp-min .Tweet-inReplyTo, .SandboxRoot.env-bp-min .Tweet-metadata { font-size: 0.9em; }';
               el.shadowRoot.appendChild(style)
           });
           // when tweets have rendered remove loader
           loaded();
       });
If you are interested in exploring the source code I’ve posted it on Github and created a TAGS Widget forum to capture questions and discussion. Enjoy!
